
-
Python 自动化: eip、cen监控数据对接到 grafana
概览
日常运维中,我们有时需要关注阿里云中 EIP 和 CEN 的监控数据,如果每次登录到平台查看,不太方便。 可以通过 API 获取监控数据,并输入到 influxDB,然后再到 Grafana 中展示,以便进行实施监控和可视化。 第一步:准备工作
在开始之前,我们需要确保已经完成以下准备工作 准备阿里云的EIP和CEN实例
这一步省略 了解如何获取EIP和CEN数据
我的方式是 EIP 通过 EIP 产品的 API 获取的,调试链接如下 https://next.api.aliyun.com/api/Vpc/2016-04-28/DescribeEipMonitorData?params={“RegionId”:”cn-hangzhou”} 输入 RegionId 和 AllocationId 等必选信息后,复制平台生成的代码,进行更改,下文会介绍如何更改 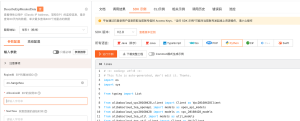
CEN 的监控数据未找到具体的 API,但可以通过云监控的数据获取,也是很方便的,链接如下 https://api.aliyun.com/api/Cms/2019-01-01/DescribeMetricData 获取 CEN 的具体数据时,可以通过 https://cms.console.aliyun.com/metric-meta/acs_cen/cen_tr?spm=a2c4g.11186623.0.0.252476ab1Ldq0T 得到 实际上,EIP 的数据也可以通过云监控获取 安装Python和所需的依赖库
下面示例的版本是截止发文时间最新版本,实际使用时,可以登录到上面的阿里云开放平台查看最新的版本 pip install alibabacloud_vpc20160428==5.1.0pip install alibabacloud_cms20190101==2.0.11安装InfluxDB,并进行初始化配置
1. 为方便使用,我这里是使用 Docker 运行的 Influxdb cd /data/influxdb# 生成初始的配置文件docker run --rm influxdb:2.7.1 influxd print-config > config.yml# 启动容器docker run --name influxdb -d -p 8086:8086 --volume `pwd`/influxdb2:/var/lib/influxdb2 --volume `pwd`/config.yml:/etc/influxdb2/config.yml influxdb:2.7.12. 安装完成后,可通过 http://ip:8086 登录到 Influxdb
3. 创建 bucket
只需要创建一个 bucket 就可以了,bucket 类似 MySQL 的 database
4. 获取 API Token,在 Python 插入数据时会用到
安装Grafana,并进行基本的配置
省略 第二步:获取API访问凭证
为了能够通过API访问阿里云的 EIP 和 CEN 数据,我们需要获取访问凭证。具体步骤如下 -
登录阿里云控制台 -
创建 RAM 用户并分配相应的权限 -
获取 RAM 用户的 Access Key ID 和 Access Key Secret
第三步:编写Python脚本
使用Python编写脚本来获取 EIP 和 CEN 的监控数据,并将其存储到 InfluxDB 中 本文仅展示部分代码,如需完整的代码,请联系本公众号获取~
调整从阿里云复制的示例代码
1. 修改构造函数,可以传如 access_key_id 和 access_key_secret def __init__(self, access_key_id: str=access_key_id, access_key_secret: str=access_key_secret):self.access_key_id = access_key_idself.access_key_secret = access_key_secret2. 修改获取 eip 数据的函数 def get_eip_monitor_data(self, region_id, allocation_id, start_time: str, end_time: str):'''参考文档:https://api.aliyun.com/api/Vpc/2016-04-28/DescribeEipMonitorData?params={%22RegionId%22:%22cn-hangzhou%22}Args:region_id (_type_): _description_allocation_id (_type_): _description_start_time (str): utc时间end_time (_type_): utc时间Yields:_type_: _description_eip_tx: 流出的流量。单位: Byteeip_rx: 流入的流量。单位: Byte'''# 请确保代码运行环境设置了环境变量 ALIBABA_CLOUD_ACCESS_KEY_ID 和 ALIBABA_CLOUD_ACCESS_KEY_SECRET。# 工程代码泄露可能会导致 AccessKey 泄露,并威胁账号下所有资源的安全性。以下代码示例使用环境变量获取 AccessKey 的方式进行调用,仅供参考,建议使用更安全的 STS 方式,更多鉴权访问方式请参见:https://help.aliyun.com/document_detail/378659.htmlclient = self.create_client(endpoint=f'vpc.{region_id}.aliyuncs.com', access_key_id=self.access_key_id, access_key_secret=self.access_key_secret)describe_eip_monitor_data_request = vpc_20160428_models.DescribeEipMonitorDataRequest(region_id=region_id,allocation_id=allocation_id,start_time=start_time,end_time=end_time)log.debug(msg=describe_eip_monitor_data_request)runtime = util_models.RuntimeOptions()log.debug(msg=runtime)try:# 复制代码运行请自行打印 API 的返回值results = client.describe_eip_monitor_data_with_options(describe_eip_monitor_data_request, runtime).body.eip_monitor_datas.eip_monitor_datafor result in results:yield resultexcept Exception as error:log.error(msg=error)return UtilClient.assert_as_string(error.message)3. 修改获取 cen 数据的函数 def get_cen_monitor_data(self, namespace, metric_name, start_time: str, end_time: str):# 请确保代码运行环境设置了环境变量 ALIBABA_CLOUD_ACCESS_KEY_ID 和 ALIBABA_CLOUD_ACCESS_KEY_SECRET。# 工程代码泄露可能会导致 AccessKey 泄露,并威胁账号下所有资源的安全性。以下代码示例使用环境变量获取 AccessKey 的方式进行调用,仅供参考,建议使用更安全的 STS 方式,更多鉴权访问方式请参见:https://help.aliyun.com/document_detail/378659.htmlclient = self.create_client(access_key_id=self.access_key_id, access_key_secret=self.access_key_secret)describe_metric_list_request = cms_20190101_models.DescribeMetricListRequest(namespace=namespace,metric_name=metric_name,start_time=start_time,end_time=end_time,)runtime = util_models.RuntimeOptions()try:# 复制代码运行请自行打印 API 的返回值return client.describe_metric_list_with_options(describe_metric_list_request, runtime).body.datapointsexcept Exception as error:# 如有需要,请打印 errorUtilClient.assert_as_string(error.message)编写InfluxDB相关的代码
将 InfluxDB 的写入代码独立出来可以方便后续其他业务的调用 下面的代码在获取 token 时,使用了 1password,可视情况进行修改,例如通过环境变量的方式获取 Token #!/usr/bin/env python3import influxdb_client, timeimport datetimefrom influxdb_client import InfluxDBClient, Point, WritePrecisionfrom influxdb_client.client.write_api import SYNCHRONOUSfrom modules.onepassword import OnePasswordmy1p = OnePassword()class InfluxClient:token = my1p.get_item_by_title(title='my_influxdb')['api']def __init__(self, url: str='http://10.1.1.1:8086', org: str='tyun', token: str=token):self.url = urlself.org = orgself.token = tokendef create_client(self):return influxdb_client.InfluxDBClient(url=self.url, token=self.token, org=self.org)def write_aliyun_eip(self, bucket: str='example', table_name: str='test1', location: str=None, eip_tx: int=None, eip_rx: int=None, time_stamp: str=None):write_api = self.create_client().write_api(write_options=SYNCHRONOUS)point = (Point(table_name).tag("location", location).field("eip_tx", eip_tx).field("eip_rx", eip_rx).time(time_stamp))write_api.write(bucket=bucket, org=self.org, record=point)def write_cen(self, bucket: str='example', table_name: str='test1', location: str=None, tr_instance_id: str=None, value: int=None, time_stamp: str=None):write_api = self.create_client().write_api(write_options=SYNCHRONOUS)point = (Point(table_name).tag("location", location).tag("tr_instance_id", tr_instance_id).field("value", value).time(time_stamp))write_api.write(bucket=bucket, org=self.org, record=point)def main():influx_client = InfluxClient()for i in range(5):influx_client.write_data(bucket='example', table_name='test1', location='hangzhou', EipBandwidth=i, EipFlow=i)time.sleep(1)if __name__ == '__main__':main()编写主程序
1. 获取 eip 并插入到 influxdb #!/usr/bin/env python3from collections import namedtuplefrom modules.aliyun.eip import Eipfrom modules.database.influxdb.write import InfluxClientfrom modules.tools.my_time import MyDatetime as my_timeeip = Eip()influx_client = InfluxClient()def insert_data(region_id, location, table_name, allocation_id, start_time, end_time):'''_summary_Args:region_id (_type_): _description_location (_type_): _description_table_name (_type_): _description_allocation_id (_type_): _description_start_time (_type_): _description_interval (int, optional): 取值的范围, 默认是5.'''eip_datas = eip.get_eip_monitor_data(region_id=region_id, allocation_id=allocation_id, start_time=start_time, end_time=end_time)for eip_data in eip_datas:# print(eip_data)influx_client.write_aliyun_eip(bucket='example',table_name=table_name,location=location,eip_rx=eip_data.eip_rx,eip_tx=eip_data.eip_tx,time_stamp=eip_data.time_stamp)Instance = namedtuple('Instance', ['region_id', 'allocation_id', 'bandwidth', 'env'])hangzhou = Instance(region_id='hangzhou', allocation_id='eip-xxxxxxxxx', bandwidth='100m', env='prod')eip_site_list = [hangzhou]for eip_site in eip_site_list:insert_data(region_id=f'cn-{eip_site.region_id}',location=f'cn-{eip_site.region_id}',table_name='eip',allocation_id=eip_site.allocation_id,start_time=my_time.get_utc_now_str_offset(offset=-60*10),end_time=my_time.get_utc_now_str())2. 获取 cen 数据并插入到 influxdb
#!/usr/bin/env python3import astfrom modules.aliyun.metrics import Metricsfrom modules.database.influxdb.write import InfluxClientfrom modules.tools.my_time import MyDatetime as my_timefrom modules.logger.client import LogClientmetrics = Metrics()influx_client = InfluxClient()log = LogClient(app='example_traffic')def tr_instance_id_to_location(tr_instance_id):if tr_instance_id == 'tr-xxxxxxxxxxxxx':location = 'hangzhou'bandwidth = '20m'else:location = 'none'return location, bandwidthmetric_names = ['AttachmentOutRate', 'AttachmentInRate']for metric_name in metric_names:results = metrics.get_cen_monitor_data(namespace='acs_cen',metric_name=metric_name,start_time=my_time.get_utc_now_str_offset(offset=-60*10),end_time=my_time.get_utc_now_str())log.debug(msg=results)for result in ast.literal_eval(results):result['metric_name'] = metric_nametrInstanceId = result['trInstanceId']result['location'] = tr_instance_id_to_location(tr_instance_id=trInstanceId)[0]result['bandwidth'] = tr_instance_id_to_location(tr_instance_id=trInstanceId)[1]log.info(msg=metric_name + ' ' + my_time.timestamp_to_str(timestamp=result['timestamp']) + ' ' + ' ' + result['location'] + ' ' + str(result['Value']))influx_client.write_cen(bucket='example',table_name=metric_name,location=result['location'],tr_instance_id=result['trInstanceId'],value=result['Value'],time_stamp=my_time.timestamp_to_str(timestamp=result['timestamp']))第四步:配置Grafana
在Grafana中配置 InfluxDB 数据源,并创建相应的仪表盘来展示 EIP 和 CEN 的监控数据。具体步骤如下: -
-
添加 InfluxDB 数据源,并配置连接信息 我用的是 Flux 的查询语言,配置数据源时,需要注意以下事项 -
数据源名字推荐使用:InfluxDB-Flux,注明是 Flux 类型的数据源 -
InfluxDB Details 填写 Organization、Token、Default Bucket 即可 -
不用填写 HTTP 认证
-
-
创建仪表盘,配置 eip 和 cen 的查询语句 · EIP 接收方向的流量
-
from(bucket: "example")|> range(start: v.timeRangeStart, stop: v.timeRangeStop)|> filter(fn: (r) => r["_measurement"] == "eip")|> filter(fn: (r) => r["_field"] == "eip_rx")|> filter(fn: (r) => r["location"] == "cn-hangzhou")|> aggregateWindow(every: v.windowPeriod, fn: last, createEmpty: false)|> map(fn: (r) => ({ r with _value: r._value / 8 }))|> yield(name: "last")· EIP 发送方向的流量 from(bucket: "example")|> range(start: v.timeRangeStart, stop: v.timeRangeStop)|> filter(fn: (r) => r["_measurement"] == "eip")|> filter(fn: (r) => r["_field"] == "eip_tx")|> filter(fn: (r) => r["location"] == "cn-hangzhou")|> aggregateWindow(every: v.windowPeriod, fn: last, createEmpty: false)|> map(fn: (r) => ({ r with _value: r._value / 8 }))|> yield(name: "last")· CEN 发送方向的流量 from(bucket: "example")|> range(start: v.timeRangeStart, stop: v.timeRangeStop)|> filter(fn: (r) => r["_measurement"] == "AttachmentOutRate")|> filter(fn: (r) => r["_field"] == "value")|> filter(fn: (r) => r["location"] == "hangzhou")|> aggregateWindow(every: v.windowPeriod, fn: last, createEmpty: false)|> yield(name: "last")· CEN 接收方向流量 from(bucket: "example")|> range(start: v.timeRangeStart, stop: v.timeRangeStop)|> filter(fn: (r) => r["_measurement"] == "AttachmentInRate")|> filter(fn: (r) => r["_field"] == "value")|> filter(fn: (r) => r["location"] == "hangzhou")|> aggregateWindow(every: v.windowPeriod, fn: last, createEmpty: false)|> yield(name: "last")-
eip 和 cen 的数据单位都是 bit/sec(SI) -
建议配置 Grafana 面板的 Thresholds 100M为 100000000,配置后会显示一条红线,可以更直观的看到流量的占用情况
总结
通过本文的步骤,我们可以通过API获取阿里云 EIP 和 CEN 的监控数据,将其存储到 InfluxDB,并通过 Grafana 进行实时监控和可视化。这为我们提供了一种自动化的方式来监控和管理阿里云网络资源。 -
云和安全管理服务商