-
基于 prometheus、istio、hpa、keda 和 karpenter,实现 k8s 应用和节点弹性
云和安全管理服务专家新钛云服 祝祥原创
介绍
在本文中,我们将描述如何创建一个基于 prometheus、istio、hpa、keda 和 karpenter 实现的可以自我扩展的 kubernetes 集群。我们将首先使用 terraform 启动 EKS 集群。然后将启动一个 nginx 服务,该 nginx 服务将能够根据我们从 prometheus 提取的指标(指标将来自 istio 入口控制器)自动扩容,本处扩容的工具将会使用 keda 。
一旦实现了上面这个逻辑,我们就可以每秒处理数百万个请求,同时也让费用花在业务需要的地方(更多实例 == 更多成本)。新资源会在需要时出现,在不需要时销毁。当然,真实的环境有更多的不可控因素,本处我们将会忽略这些因素。
启动 EKS 集群
HashiCorp Terraform是一个IT基础架构自动化编排工具,可以用代码来管理维护IT资源。它编写了描述云资源拓扑的配置文件中的基础结构,例如虚拟机、存储账户和网络接口。Terraform的命令行接口(Command Line Interface,CLI)提供一种简单机制,用于将配置文件部署到 AWS 或其他任意支持的云上,并对其进行版本控制。
使用 terraform,我们将在 AWS 中创建一个 EKS 集群。我们还通过 helm 配置 IAM 并安装 karpenter。
module "eks" {
source          = "terraform-aws-modules/eks/aws"
  version         = "<18"
cluster_version = "1.21"
  cluster_name    = var.cluster_name
  vpc_id          = module.vpc.vpc_id
  subnets         = module.vpc.private_subnets
  enable_irsa     = true
# Only need one node to get Karpenter up and running
  worker_groups = [
    {
      instance_type = "t3a.medium"
      asg_max_size  = 1
    }
  ]
}
resource "helm_release" "karpenter" {
depends_on       = [module.eks.kubeconfig]
  namespace        = "karpenter"
  create_namespace = true
name       = "karpenter"
  repository = "https://charts.karpenter.sh"
  chart      = "karpenter"
  version    = "v0.16.0"
set {
    name  = "serviceAccount.annotations.eks\\.amazonaws\\.com/role-arn"
    value = module.iam_assumable_role_karpenter.iam_role_arn
  }
set {
    name  = "clusterName"
    value = var.cluster_name
  }
set {
    name  = "clusterEndpoint"
    value = module.eks.cluster_endpoint
  }
}
data "aws_iam_policy" "ssm_managed_instance" {
  arn = "arn:aws:iam::aws:policy/AmazonSSMManagedInstanceCore"
}
resource "aws_iam_role_policy_attachment" "karpenter_ssm_policy" {
  role       = module.eks.worker_iam_role_name
  policy_arn = data.aws_iam_policy.ssm_managed_instance.arn
}
resource "aws_iam_instance_profile" "karpenter" {
  name = "KarpenterNodeInstanceProfile-${var.cluster_name}"
  role = module.eks.worker_iam_role_name
}
module "iam_assumable_role_karpenter" {
  source                        = "terraform-aws-modules/iam/aws//modules/iam-assumable-role-with-oidc"
  version                       = "4.7.0"
  create_role                   = true
  role_name                     = "karpenter-controller-${var.cluster_name}"
  provider_url                  = module.eks.cluster_oidc_issuer_url
  oidc_fully_qualified_subjects = ["system:serviceaccount:karpenter:karpenter"]
}
resource "aws_iam_role_policy" "karpenter_controller" {
  name = "karpenter-policy-${var.cluster_name}"
  role = module.iam_assumable_role_karpenter.iam_role_name
policy = jsonencode({
    Version = "2012-10-17"
    Statement = [
      {
        Action = [
          "ec2:CreateLaunchTemplate",
          "ec2:CreateFleet",
          "ec2:RunInstances",
          "ec2:CreateTags",
          "iam:PassRole",
          "ec2:TerminateInstances",
          "ec2:DescribeLaunchTemplates",
          "ec2:DescribeInstances",
          "ec2:DescribeSecurityGroups",
          "ec2:DescribeSubnets",
          "ec2:DescribeInstanceTypes",
          "ec2:DescribeInstanceTypeOfferings",
          "ec2:DescribeAvailabilityZones",
          "ssm:GetParameter"
        ]
        Effect   = "Allow"
        Resource = "*"
      },
    ]
  })
}
provider "aws" {
  region              = "us-east-1"
}
variable "cluster_name" {
  description = "The name of the cluster"
  type        = string
}
module "vpc" {
  source = "terraform-aws-modules/vpc/aws"
name = var.cluster_name
  cidr = "10.0.0.0/16"
azs             = ["us-east-1a", "us-east-1b", "us-east-1c"]
  private_subnets = ["10.0.1.0/24", "10.0.2.0/24", "10.0.3.0/24"]
  public_subnets  = ["10.0.101.0/24", "10.0.102.0/24", "10.0.103.0/24"]
enable_nat_gateway     = true
  single_nat_gateway     = true
  one_nat_gateway_per_az = false
private_subnet_tags = {
    "kubernetes.io/cluster/${var.cluster_name}" = "owned"
  }
}
这里重要的是 IAM 策略,这将让 karpenter 读取元数据并创建必要的资源。
terraform plan --var cluster_name="chris"
terraform apply --var cluster_name="chris"
aws eks update-kubeconfig --name chris
确保一切顺利,我们可以使用 kubectl 命令来验证集群是否就绪。
配置 istio 和 prometheus
目前,我们准备好了一个空负载的集群,我们首先要安装 prometheus,我们使用 kube-prometheus-stack (
https://github.com/prometheus-community/helm-charts/tree/main/charts/kube-prometheus-stack) prometheus Operator 安装以及管理 kubernetes 上的监控。它允许我们使用 kubernetes CRD 来配置目标、定义抓取端点、控制 prometheus 服务,所有操作都可以通过 CLI 完成。下面,我们将通过 helm 在 k8s 上安装 prometheus。使用 helm 安装
helm repo add prometheus-community https://prometheus-community.github.io/helm-charts
helm repo update
helm install prometheus prometheus-community/kube-prometheus-stack -n monitoring几分钟后,我们可以看到 helm 创建的几个有状态集、部署和守护程序集。我们可以通过访问 Prometheus CRD 查看 prometheus 的配置。
kubectl get pods -n monitoring
kubectl get Prometheus -n monitoring注意:如果 prometheus 没有配置相关的存储卷,所以指标信息会在重启时丢失。
Prometheus 现在可以从 k8s api、节点和其他组件中获取指标。我们还可以从其他应用程序(如 istio!)导入指标。我们还想从 istio sidecar 中获取指标,这样我们就可以对其进行扩展。
我们在集群上安装 istio,告诉它把 sidecar 注入到所有从 web 命名空间开始的 pod 中。
istioctl manifest install
一切就绪后,将应用网关和虚拟服务。下面的配置只是告诉 istio 将主机名为 chris.somecompany.com 流量发送到 nginx pod。
—
apiVersion: networking.istio.io/v1alpha3
kind: Gateway
metadata:
name: gateway
namespace: istio-system
spec:
selector:
app: istio-ingressgateway
servers:
– port:
number: 8080
name: http
protocol: HTTP
hosts:
– “chris.somecompany.com”
—
apiVersion: networking.istio.io/v1alpha3
kind: VirtualService
metadata:
name: nginx
namespace: web
spec:
gateways:
– istio-system/gateway
hosts:
– “chris.somecompany.com”
http:
– route:
– destination:
host: nginx.web.svc.cluster.local创建并标记 Web 命名空间
kubectl create ns web
kubectl label namespace default istio-injection=enabled –overwrite创建 nginx pod 和服务
kubectl -n web create deploy nginx –image=nginx –port 80
kubectl -n web expose deploy nginx –port 80我们可以看到 nginx pod 以两个容器启动。这将是 nginx 和 istio sidecar 容器。
kubectl -n web get pods
NAME READY STATUS RESTARTS AGE
nginx-6c8b449b8f-wkvd6 2/2 Running 0 6s我们还想定义一个 Service Entry 和 Pod Monitor 来告诉 prometheus 从 istio 抓取指标。当然,您可以随意标记这些内容,但以下是定义的指标抓取配置内容。
apiVersion: monitoring.coreos.com/v1
kind: PodMonitor
metadata:
name: envoy-stats-monitor
namespace: istio-system
labels:
monitoring: istio-proxies
release: prometheus
spec:
selector:
matchExpressions:
– {key: istio-prometheus-ignore, operator: DoesNotExist}
namespaceSelector:
any: true
jobLabel: envoy-stats
podMetricsEndpoints:
– path: /stats/prometheus
interval: 15s
relabelings:
– action: keep
sourceLabels: [__meta_kubernetes_pod_container_name]
regex: “istio-proxy”
– action: keep
sourceLabels: [__meta_kubernetes_pod_annotationpresent_prometheus_io_scrape]
– sourceLabels: [__address__, __meta_kubernetes_pod_annotation_prometheus_io_port]
action: replace
regex: ([^:]+)(?::\d+)?;(\d+)
replacement: $1:$2
targetLabel: __address__
– action: labeldrop
regex: “__meta_kubernetes_pod_label_(.+)”
– sourceLabels: [__meta_kubernetes_namespace]
action: replace
targetLabel: namespace
– sourceLabels: [__meta_kubernetes_pod_name]
action: replace
targetLabel: pod_name
—
apiVersion: monitoring.coreos.com/v1
kind: ServiceMonitor
metadata:
name: istio-component-monitor
namespace: istio-system
labels:
monitoring: istio-components
release: prometheus
spec:
jobLabel: istio
targetLabels: [app]
selector:
matchExpressions:
– {key: istio, operator: In, values: [pilot]}
namespaceSelector:
any: true
endpoints:
– port: http-monitoring
interval: 15s通过入口网关发送一些流量,我们应该看到 nginx 数据返回。这告诉我们数据包从入口网关到达 nginx 容器,从而达到增加访问的数量的目的。
# Create foreground tunnel
kubectl -n istio-system port-forward svc/istio-ingressgateway 8080发送一个 http 请求。
curl -H 'Host: chris.somecompany.com' localhost:8080 | grep --color -i title

<title>Welcome to nginx!</title>
连接prometheus,看看targets
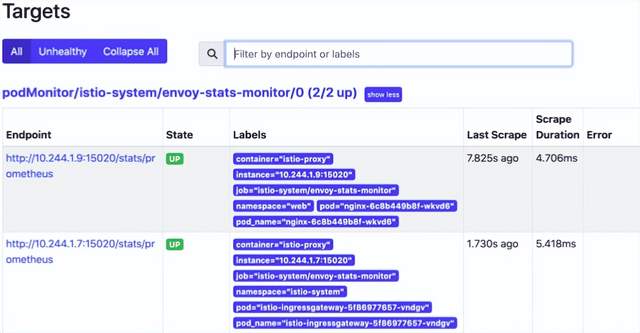
kubectl -n monitoring port-forward svc/prometheus-operated 9090我们可以看到我们有一个带有有效目标的 envoy-stats-monitor,prometheus 正在寻找我们的 nginx 容器和指标端点。这些指标来自每个 pod 运行的 istio sidecar。
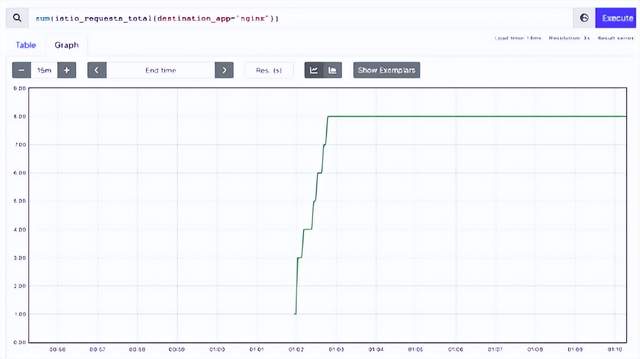
使用 nginx 标签查询 istio_requests_total 指标会给我们一个计数。
um(istio_requests_total{destination_app="nginx"})上述返回的结果是 8,这意味着 nginx 容器已经被访问了 8 次。
我们现在配置好了 istio 和 prometheus 。如果我们还有其他需要处理的指标,我们可以在此基础上进行扩展!
安装keda并定义HPA
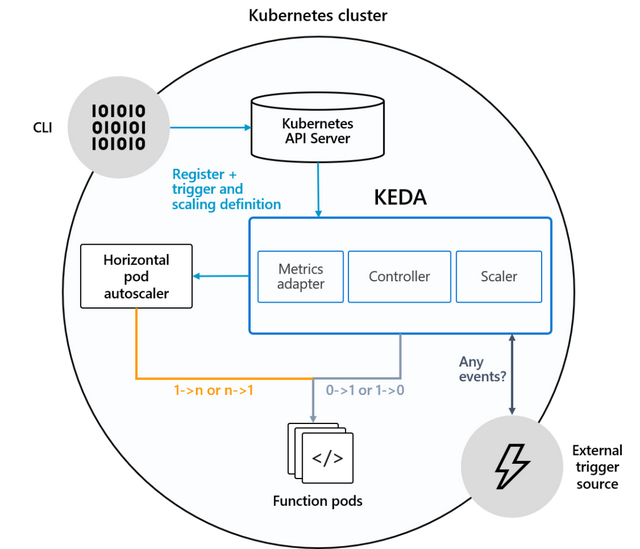
KEDA 使 Kubernetes 能够根据标准内置 Kubernetes 指标(如 CPU 和内存)以及高级指标(如消息队列的队列深度、每秒请求数、计划的 cron 作业)等指标将 pod 副本扩展到零和向上,来自自己的应用程序日志记录的自定义指标以及您可以想象的任何其他指标。这是 Kubernetes 中内置的 HPA 无法轻易做到的。
我们将通过 helm 安装 keda 。通过这个开源工具,我们可以添加到 kubernetes 以响应事件(在此文中将用于触发来自 prometheus 指标的事件)。
通过 helm 安装 keda
helm repo add kedacore https://kedacore.github.io/charts
helm repo update
kubectl create namespace keda
helm install keda kedacore/keda –namespace keda然后我们将定义一个 ScaledObject CRD,它将监控来自 prometheus 的 istio_requests_total 指标。如果指标计数超过 10,那么我们的 pod 副本将会增加。
创建 CRD
—
apiVersion: keda.sh/v1alpha1
kind: ScaledObject
metadata:
name: nginx
namespace: web
spec:
scaleTargetRef:
kind: Deployment
name: nginx
minReplicaCount: 1
maxReplicaCount: 10
cooldownPeriod: 30
pollingInterval: 1
triggers:
– type: prometheus
metadata:
serverAddress: http://prometheus-operated.monitoring:9090
metricName: istio_requests_total_keda
query: |
sum(istio_requests_total{destination_app=”nginx”})
threshold: “10”还创建了一个 HPA,它将实际更改 pod 数量
kubectl -n web get hpa keda-hpa-nginx
产生一些流量
curl -H ‘Host: chris.somecompany.com’ localhost:8080 | grep –color -i title
<title>Welcome to nginx!</title>一旦我们产生了足够的流量,我们可以看到 keda 增加了 HPA 上的副本数,现在我们有了更多的 pod 副本。
我们只是通过监控 prometheus 的指标来增加 pod 副本!
# New HPA valueskubectl get hpa -n web
NAME REFERENCE TARGETS MINPODS MAXPODS REPLICAS AGE
keda-hpa-nginx Deployment/nginx 8667m/10 (avg) 1 10 3 11m
kubectl get pods -n web
NAME READY STATUS RESTARTS AGE
nginx-6c8b449b8f-7mr4x 2/2 Running 0 3m29s
nginx-6c8b449b8f-lfmdv 0/2 PodInitializing 0
nginx-6c8b449b8f-wkvd6 2/2 Running 0 41m通过下面的命令,我们可以了解为什么它会以这种方式进行扩展。
kubectl describe hpa keda-hpa-nginx -n web
Normal SuccessfulRescale 6m18s horizontal-pod-autoscaler New size: 3;
reason: external metric s0-prometheus-istio_requests_total_keda(&LabelSelector{MatchLabels:map[string]string{scaledobject.keda.sh/name: nginx,},MatchExpressions:[]LabelSelectorRequirement{},}) above targetKarpenter
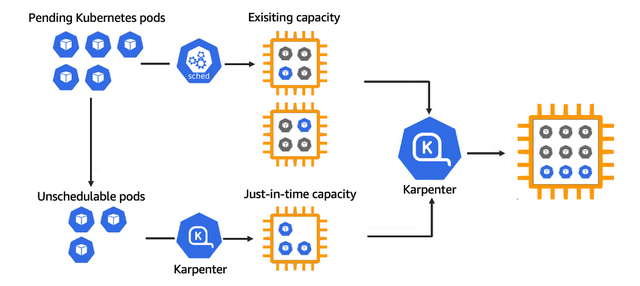
Karpenter 是一个为 Kubernetes 构建的开源自动扩缩容项目。它提高了 Kubernetes 应用程序的可用性,而无需手动或过度配置计算资源。Karpenter 旨在通过观察不可调度的 Pod 的聚合资源请求并做出启动和终止节点的决策,以最大限度地减少调度延迟,从而在几秒钟内(而不是几分钟)提供合适的计算资源来满足您的应用程序的需求。
我们在启动集群的时候同时安装了karpenter,但是我们没有配置它。如果您查看我们使用 terraform 定义的自动缩放组 (ASG),它的最大值为 1,因此此时应该运行 1 个 ec2 实例。
如果希望使用 helm 手动安装的话,可以参考如下命令:
helm repo add karpenter https://charts.karpenter.sh/
helm repo update
helm upgrade –install –namespace karpenter –create-namespace \
karpenter karpenter/karpenter \
–version v0.6.3 \
–set serviceAccount.annotations.”eks\.amazonaws\.com/role-arn”=${KARPENTER_IAM_ROLE_ARN} \
–set clusterName=${CLUSTER_NAME} \
–set clusterEndpoint=${CLUSTER_ENDPOINT} \
–set aws.defaultInstanceProfile=KarpenterNodeInstanceProfile-${CLUSTER_NAME} \
–set logLevel=debug \
–waitHPA 会根据负载添加更多的 Pod,但是如果我们的节点空间不足怎么办?这将是我们需要使用 karpenter 的地方。
我们要定义一些我们需要的大小,并告诉它使用标签和应用哪个集群。
apiVersion: karpenter.sh/v1alpha5
kind: Provisioner
metadata:
  name: default
spec:
  requirements:
    - key: karpenter.sh/capacity-type
      operator: In
      values: ["on-demand"]
  limits:
    resources:
      cpu: 1000
      memory: 1000Gi
  provider:
    subnetSelector:
      kubernetes.io/cluster/chris: '*'
    securityGroupSelector:
      kubernetes.io/cluster/chris: '*'
    instanceProfile: chris2022090904481313660000000c
  ttlSecondsAfterEmpty: 30
  ttlSecondsUntilExpired: 2592000
因此,如果因负载上升,导致新增加了很多 pod,karpenter 将使用
chris2022090904481313660000000c 配置文件启动更多节点。当然,您可以添加更多组和设置,目前的配置已经够用了。我们可以继续生成流量,这将增加监控指标的计数,这将告诉 HPA 需要添加更多副本。Pod 将进入挂起状态,因为它们此时没有足够的资源来被调度。
kubectl get pods | grep Pend
nginx-6799fc88d8-2rplf   0/1     Pending            0          32s
nginx-6799fc88d8-8ln6v   0/1     Pending            0          32s
nginx-6799fc88d8-hhhgn   0/1     Pending            0          32s
nginx-6799fc88d8-mfh7v   0/1     Pending            0          32s
nginx-6799fc88d8-nmdtj   0/1     Pending            0          32s
nginx-6799fc88d8-rjnfx   0/1     Pending            0          32s
nginx-6799fc88d8-szgnd   0/1     Pending            0          32s
nginx-6799fc88d8-t9p6s   0/1     Pending            0          32s
但是一旦新节点出现,所有这些都将开始运行。
nginx-6799fc88d8-cc8x5   1/1     Running        0          24s
nginx-6799fc88d8-cpzx6   1/1     Running        0          46s
nginx-6799fc88d8-dlz4d   1/1     Running        0          24s
nginx-6799fc88d8-gwdrh   1/1     Running        0          24s
nginx-6799fc88d8-hg4s6   1/1     Running        0          24s
如果要按比例缩小副本了,那么节点也会销毁。
概括
通过本文,我们创建了一个 kubernetes 集群,该集群将使用 karpenter 根据资源动态添加节点,我们可以通过查看来自 istio 的 prometheus 指标来控制 pod 的数量。最终,我们创建了一个不错的自动缩放集群,在实现高弹性,高负载的前提下达成了降本增效的要求。
云和安全管理服务商